This update contains the following changes:
- Added Resource Graphs functionality
- Added nodebuggl command line flag to disable OpenGL error checking
- Fixed a bug where metal was not refunded for using the remove mode on tracks
- Fixed incorrect event text for one of the PR Campaign options
- Fixed regression where combustion engines would fail to use tanked fuel when the Train Core is empty
The resource graphs window contains several infographics:
Produced/Consumed/Used:
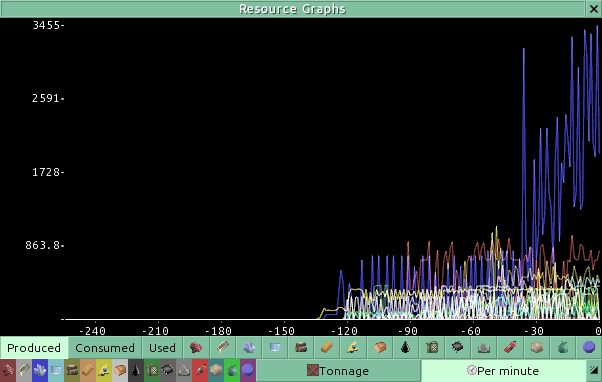
These tabs show line charts with historical data about every resource.
Produced - The sum of imports and production of industries
Consumed - The sum of exports and consumption of industries and combustion engines
Used - The sum used by player actions, e.g. building infrastructure and trains, minus metal refunds.
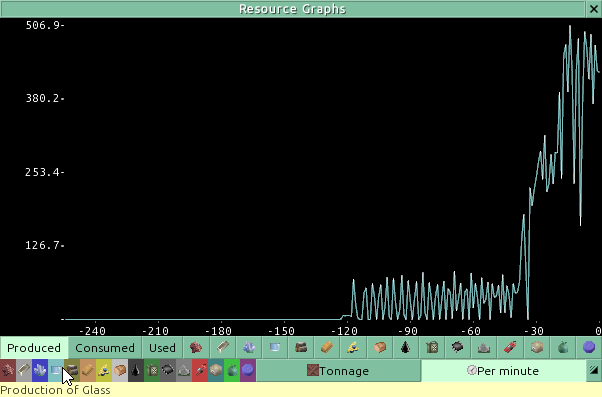
Hovering the mouse over the legend isolates the line for single resource.
Resource Allocation:
These tabs show bar charts illustrating the allocation of a specific resource. For instance, in the Waste tab:
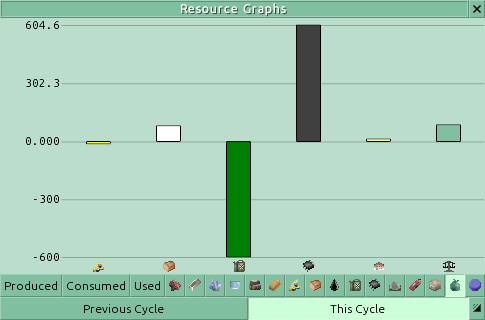
These bars, from left to right, indicate that this cycle:
A small amount of Waste has been consumed by Produce production (Farms)
Some Waste has been produced by Food production
A lot of Waste has been consumed by Fuel production
A lot of Waste has been produced by Semiconductor production
A small amount of Waste has been produced by the Town
In sum, Waste production has been somewhat greater than Waste consumption
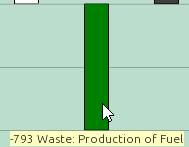
Hovering the mouse over a bar shows information about it.