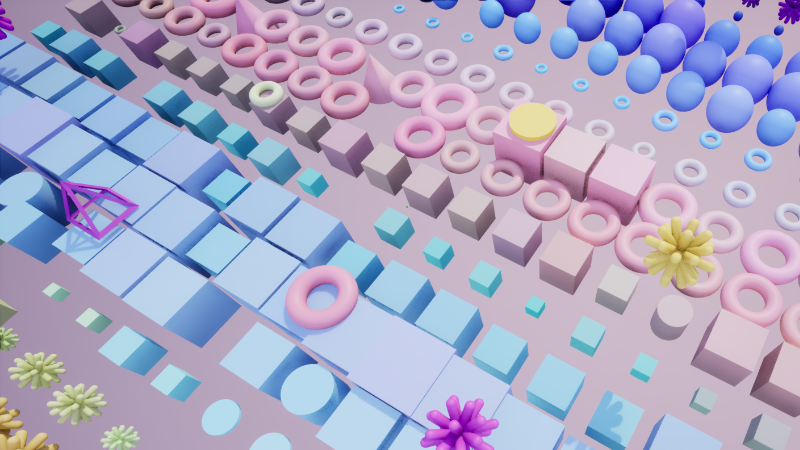
The Prop explorer treats your CSV's rows as objects and its Columns as Properties.
Drag and drop Rows into the world (or pull all) and use a number of marking options to transform each object based on their row(s) values to (hopefully) reveal similarities, groups and trends.
Options include:
Unique column value selection
Random Projection Coloring
Similarity Networks
K-Means Clustering
Behavior mapping (sort of like dancing)
Percentile Grouping
Value Sequencing (color/size)
More from First-Person Data Explorer
Other announcements
Small Patch: Startup and Context Menu FixesA small corrective patch for FPDE is now live. It addresses two recently reported issues: - The unnecessary Windows Firewall prompt that could appear when starting FPDE should no longer occur. - Explorer context menus now allow more cursor movement before closing, making it easier to reach their controls. Thank you to the players who reported these issues, please let me know in the Discussions…First-Person Data Explorer Will Become a Paid Game on August 24Hello Everyone, I wanted to share an important update about First-Person Data Explorer. On August 24th, 2026, FPDE will change from being a free game to a paid game. Its price will be $2.99 USD, with Steam regional pricing other currencies. If you already have FPDE, nothing will change regarding your access. You will still be able to play it without purchasing it again. Also, until the change t…🎵 Melody Update for The Prop Explorer 🎵Data Becomes Melody in the Prop Explorer Sound Update - live on Steam! How can data sing? The (very) experimental system uses two deterministic random-projection passes and a K-Means clustering pass to turn each row of data into a stable 16-step musical fingerprint (one bar of melody). First Random Projection is for Pitch: Each row’s normalized feature values are projected into 16 pitch scores.…